
In March 2018, an interesting paper was published by the fund manager, interview partner and author Pim Van Vliet and David Blitz. It examines the question of whether and how well a simple factor strategy works in comparison to complex systematic approaches. I present the starting point, the data used, the analysis and the results without going into detail. I find the findings exciting and I am curious to hear what you have to say about them.
The starting position
The authors chose the following three factors for their model:
- low volatility
- high net payout yield
- strong momentum
The volatility describes the fluctuation or statistically the standard deviation of the price over a certain period of time. “Net Payout Yield” is the return of investors after dividend yield and share buybacks. Momentum is a term used in technical stock analysis and is in principle an index calculation. It is all about a good price performance.
Data and analysis
data
- 1000 equities Large-Cap are selected
- Market data are used
- Database: US shares from 1926 onwards
- In addition: Europe, Japan and Emerging Markets to check the effectiveness of the model on other markets as well (again 1,000 shares each; unfortunately the data does not go back to 1926).
analysis
2 groups of 500 shares each are formed based on the historical 36-month yield volatility. Then each share with a low volatility is ranked with the other two factors. Momentum and Net Payout Yield are averaged and 100 final shares are formed from these, which are added to the portfolio (each with the same weighting). In addition, a “speculative portfolio” has been created, which contains the stocks with the highest volatility and the worst values of momentum and volatility.
Results
The diagrams inserted below are the result of the evaluation. On the horizontal axis we see the volatility, on the vertical axis the average return.
In general, the result is summarized as follows:
We find that a conservative portfolio consisting of 100 low-risk stocks with high net payout yield and
positive price momentum returned 15.1 percent per year since 1929. The performance is persistent over
time, with positive returns in every decade. It outperforms a portfolio of speculative stocks with the
opposite characteristics (high risk, low net payout yield and negative momentum) by 12.8 percent per
year, with lower risk. For US mid-caps, Europe, Japan and Emerging markets we find similar results.
“Factor investing” has also experienced an upswing in ETFs with smart betas. Of course, these factors should also be criticised. But I would like to shift this discussion to the comments and ask you what you think about it. And how you judge the results of the paper. You can download the document here if you want more information:
The Conservative Formular: Quantitative Investing Made Easy
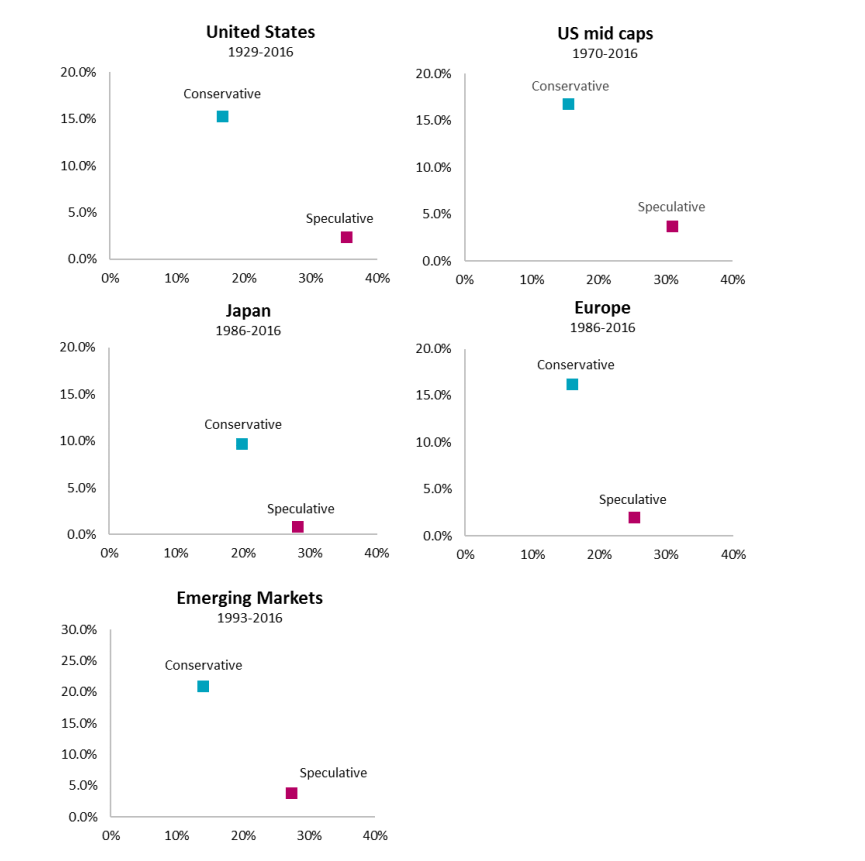
quantitive investing made easy figure 2 (c) Pim Van Vliet and David Blitz
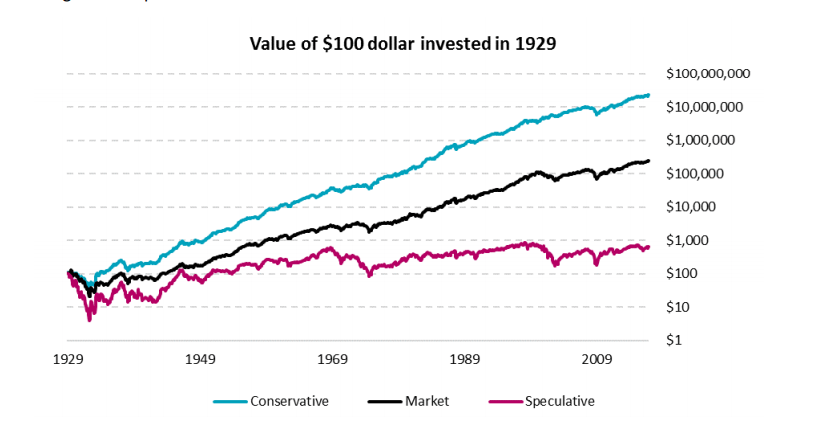
Was wäre aus 100 Dollar geworden? (c) Pim Van Vliet and David Blitz